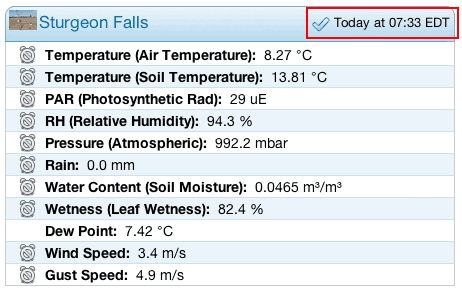
Current Conditions as of “Last Updated” Time
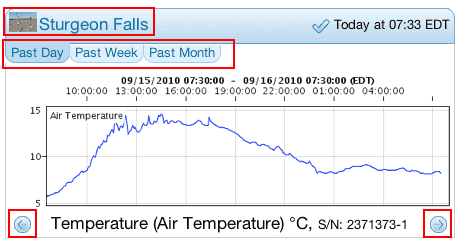
Graphs of Past Conditions
- You can click on individual weather stations to link to a more detailed web page.
- You can look at graphs for the past day, week, or month (as long as the weather station has been running for such periods).
- You can also scroll between graphs of different sensors by clicking on the arrows.
Alarms
Alarms can be set by the administrator of the website.
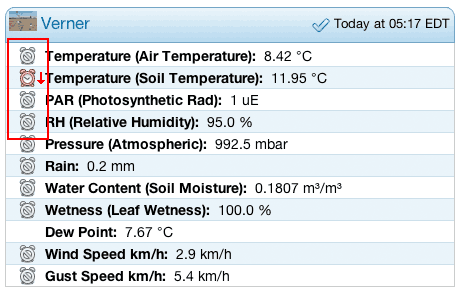
If a reading falls below or above a certain threshold value, an alarm will be issued. The alarms are visible on the web page, but may also be available through email or text message to a cellular phone (as set by the administrator of the website).
Alarm Status:
- Red: sensor has recorded values outside threshold
- Green: alarm is active, but readings are within threshold
- Grey: no alarm has been established
- Yellow: administrator has set a change in the alarm, change is still pending
Example: the administrator may create an alarm that is tripped when the temperature is below 15°C. When the sensor detects a temperature below 15°C, the alarm status will turn to red with a down arrow (indicating the reading is below a set value) and emails/text messages will be sent out as issued by the administrator.


